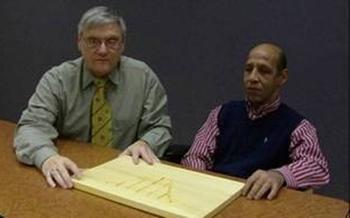
A Film Demonstration and Assessment of a Teaching Artifact for the Instruction of Statistics to Visually Impaired College Students
•Frank Cumming, BSW is a visually impaired alumni who volunteered to review our statistical artifact. Mr. Cummings signed a release form to enable us to share the film to assist others to learn about visional disorders.
•George Johnson, MA is an Engineer and Instructor for the Mass Communication Department at the University of North Carolina at Pembroke. Mr. Johnson provided the technical guidance for the development and uploading of this film.
•Stephen M. Marson, Ph.D. is a Professor of Sociology at the University of North Carolina at Pembroke. Among other courses, he teaches an entry level statistics course for Criminal Justice, Nursing, Social Work and Sociology Majors.
•Adam Walls, MFA is a Professor of Sculpture at the University of North Carolina at Pembroke. For the filming, he operated the camera and constructed the normal distribution.
Commentary
How can one envision a normal distribution with standard deviations without being able to see a drawing of it? Three options for hand-seeing are available:
1. One could construct a 3-dimensional normal distribution. This would give the student an opportunity to feel a curve and insert standard deviations in it. In this manner, the student could “see” the 68-95-99.7 rule. Of the three options, this protocol is the most complex and expensive to construct. 2. On a piece of wood, one could use a router and product an indentation of a normal distribution. Indentations could be routed to represent standard deviations. 3. On could use clay and form a normal distribution on a wood platform. Again, standard deviation could extend from the surface of the wood.
Although all three options afford the blind student an opportunity to “feel” a normal distribution, Landau, Russell, Gourgey, Erin, and Cowan (2003) suggests that the third option is best. Of the three options, the third is most like Braille. However, blind students (like sighted students), do not share a common learning strategy. For example, our student strongly preferred router style over the Braille style. Thus, it may not be a bad idea to include all three strategies within one’s teaching repertoire. “Which of the three strategies is best?” is an empirical question. Within our film, Mr. Cumming indicated that he liked the third option best
Landau, S., Russell, M., Gourgey, K., Erin, J., & Cowan, J. (2003). Use of the talking tactile tablet in mathematics testing. Journal of Visual Impairment & Blindness, 97(2), 85-96.